Process Improvement
Davies Award of Excellence

Executive Summary
Improving the usability of electronic health records (EHR) can lead to an improvement in the documentation of key quality measures. The quality measures that were evaluated in this study include screening for Advance Directives, Depression, Falls Risk, and Alcohol and Drug Misuse. A multidisciplinary team at the University of Missouri Health Care undertook a quality improvement project in which the user interface used to prompt and perform annual screening in ambulatory settings was redesigned, and clinical decision support was added to improve visibility and actionability for providers.
As part of the quality improvement project, the existing UI was redesigned, defects were corrected, and screening practices improved. By achieving improvements in task time, error rates, and System Usability Scale scores, the team made significant improvements in identified screening rates after implementation of the redesigned UI compared with the original implementation.
Data prior to implementation of the new UI and the most recent data as of this writing:
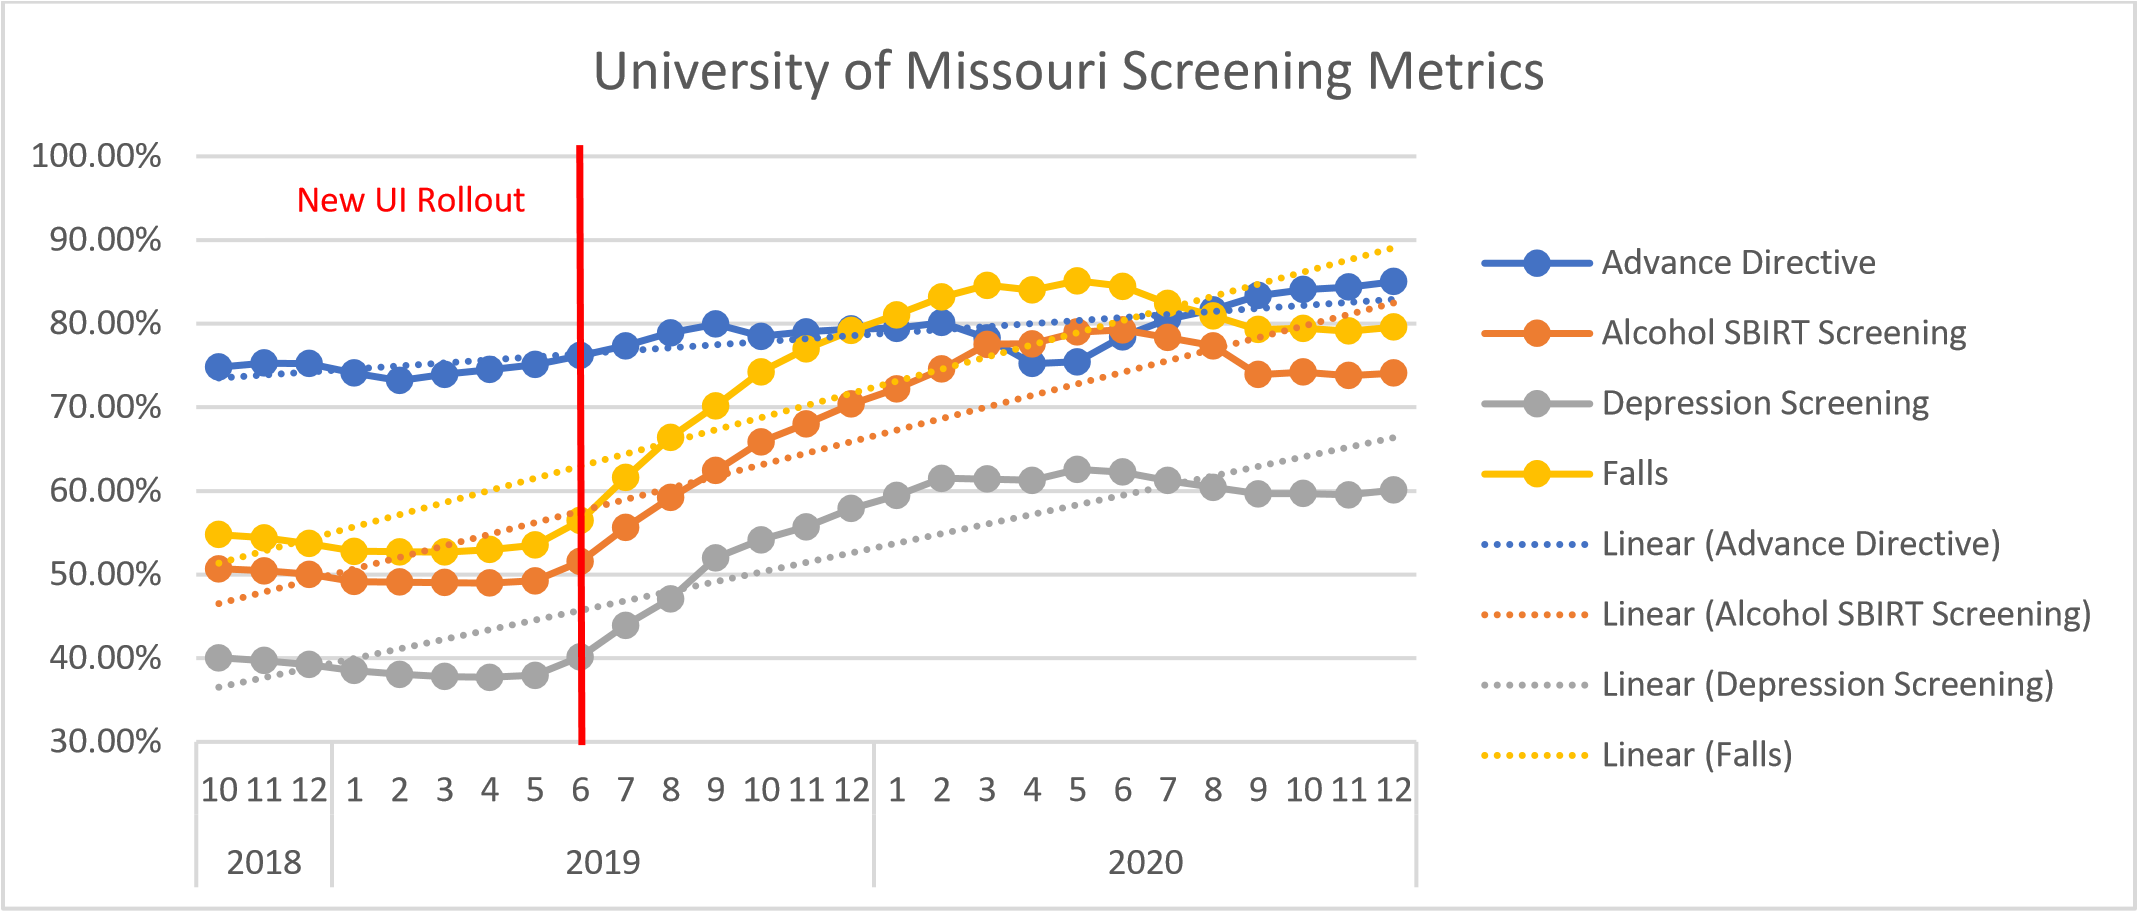
- Advance Directive Screening improved from 74% in Oct. 2018 to 85% in Dec. 2020.
- Depression Screening improved from 40% in Oct.2018 to 60% in Dec. 2020.
- Falls Risk Screening improved from 55% to 80% in Dec. 2020.
- Alcohol and Drug Misuse Screening improved from 50% to 74% in Dec. 2020.
Lessons learned include:
- Do not be afraid to redesign a UI even if it’s been in place for a long time.
- Efficiency, effectiveness, and satisfaction can be achieved simultaneously and concurrently along with improved delivery to quality patient care.
- Usability Testing has a valuable role in local configurations.
- Can be used quantitatively to validate solutions
- Fewer errors
- Fewer clicks
- Reduced task time
- Better user satisfaction
- Improved documentation of quality improvement metrics
- Can be used qualitatively to make iterative improvements to solutions
- Formal training and prior experience with usability testing is not required (but it helps)
- Recruitment of participants can be challenging
Define the Clinical Problem and Pre-Implementation Performance
Annual assessment screens for depression, alcohol and drug misuse, advance directives, and fall risk are part of the routine intake at University of Missouri Health Care ambulatory settings. The screens allow staff and providers to identify those at-risk and target evidence-based interventions.1-3 The intake assessments are documented in the EHR supplier’s user interface (UI) which has been in place for several years. In the course of their clinical work, users encountered nurses and medical assistants who described difficulty with this UI. Staff who have worked in other systems, describe the process of annual assessment screening as “not user friendly” and require “too many clicks.” Often providers aren’t aware when an annual assessment screening for depression, falls risk, alcohol/drug use, or advance directives are due or notified of patients whose screens are positive. These problems potentially contribute to lower-than-expected rates of screening for clinically important conditions. Therefore, a two-phase QI project was undertaken in which the interface underwent a usability-focused redesign, and then clinical decision support (CDS) alerts were added to improve the visibility and actionability of the screening results.
The table below (Table 1) describes the measure, measure description, and measure steward. Three quality measures—advance care planning, depression screening, and fall-risk screening— are quality measures in the Merit-based Incentive Payment System, and data were generated according to definitions used for that program. The fourth measure, alcohol screening, was customized according to requirements for the state Medicaid Primary Care Health Home program.
Table 1. Quality measures used in the project.
Source: University of Missouri Health Care
In a period of 8 months prior to the intervention, performance had been stable or slightly dropping. The quality metric performance prior to implementation and at the time of this writing are as follows:
- Advance Directive Screening improved from 74% in Oct. 2018 to 85% in Dec. 2020.
- Depression Screening improved from 40% in Oct.2018 to 60% in Dec. 2020.
- Falls Risk Screening improved from 55% to 80% in Dec. 2020.
- Alcohol and Drug Misuse Screening improved from 50% to 74% in Dec. 2020.
Design and Implementation Model Practices and Governance
The multidisciplinary redesign team consisted of physicians, nurses, clinical informaticists, integration architects, ambulatory department quality leadership, and other supporting roles oversaw the QI project. The UI was redesigned over 8 months using a collaborative, multidisciplinary, iterative process. The health system was responsible for the redesign and implementation, and the vendor had no direct role in the process. Health system physicians and nurse informaticists oversaw the work, with input from nurses, medical assistants, administrators, and clinical QI specialists. The team also included system architects, employed by the vendor, responsible for the site- specific implementation.
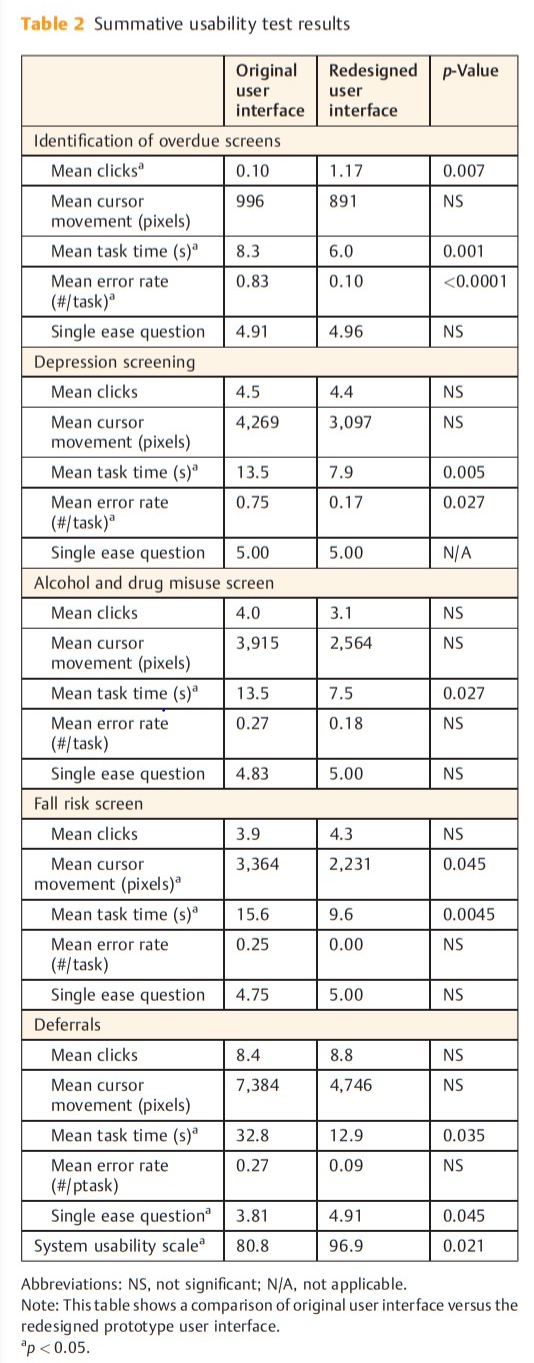
Summative usability testing was performed as part of the product development and implementation cycle to further develop and evaluate the prototype. The tasks were designed and tested by an ad hoc group of six clinical informaticists with an interest in improving the usability of the vendor’s implementation at the University of Missouri. The group had representation from medical staff, nursing, and solution architects. Summative usability testing demonstrated improvements in task time, error rates, and System Usability Scale scores.
The redesigned UI was deployed in the production environment in June 2019. Staff members were notified of the changes by email. Clinical nursing representatives received a live demonstration and education on the redesigned UI to other staff. No follow-up educational measures were deployed or deemed necessary.
In the second phase of the project, the multidisciplinary team designed CDS alerts for providers using an iterative, user-centered design process. The alerts supported simple, clear entry of clinical interventions related to abnormal screens. Summative usability testing was performed by the same ad hoc group that performed phase one testing. Phase two was implemented April of 2020. Providers received an email notifying them of the implementation, and an educational document with screenshots and instructions was attached. No follow-up educational measures were deployed or deemed necessary.
Overall governance for the project was provided by the University of Missouri Clinical Decision Support (CDS) Oversight Committee. This committee is comprised of nurse leadership, clinical (nurse and physician) informaticists, pharmacists, solution architects, and physician leadership from a range of specialties. The committee approved the project prior to redesign, reviewed summative usability test results, and approved the final implementation.
Clinical Transformation enabled through Information and Technology
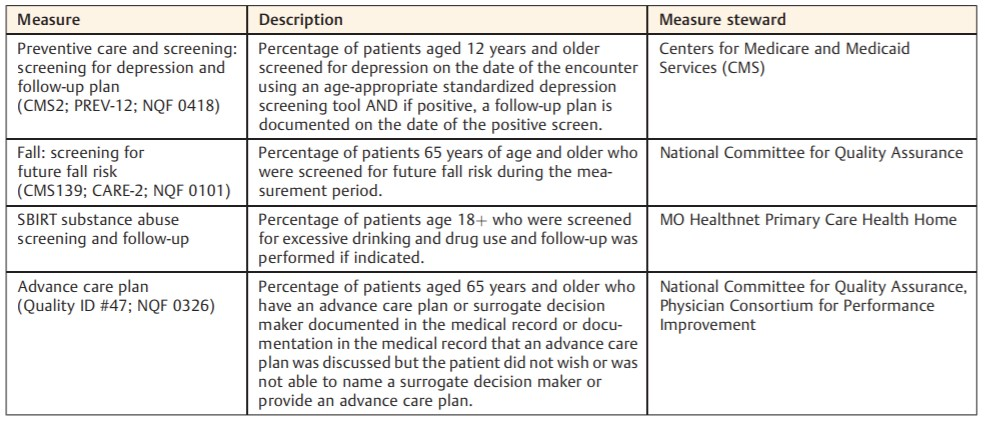
From a technology perspective, the vendor’s platform on which the UI is built supported text and date fields, as well as checkbox, radio button, and read only controls. It supported the required settings, simple calculations, default values, and basic conditional application behavior. It did not natively support the complex conditional logic required to accurately prompt annual assessment screening. A novel approach resolved the complex conditional logic at runtime in a separate application program, then sent a “hidden” binary variable to the UI platform, reflecting whether screening was due. The basic conditional application behavior native to the platform then used this variable to produce the proper UI behavior. UI mock-ups based on the heuristic analysis were created to demonstrate proposed changes and to gather input from stakeholders. The design was modified based on feedback from providers, nurses, medical assistants and administrators. Labels were modified for consistency, clarity and the “days since last screening” field was removed. Controls were added with options for documenting the reason screening could not be performed at that encounter (“deferral reasons”). In the final prototype (Fig. 1), one date field was removed, and another was configured to auto populate. The date of prior screening was added to the UI in a read-only format.

Source: University of Missouri Health Care
Conditional logic used patient age, current problems and date of last screen to generate an unambiguous, color-coded indication that screening is due. Options for deferral reasons were added and conditionally enabled. From the redesigned UI, users could launch modal dialogs which contain the actual screening questions (i.e., the Physician Health Questionnaire-9 for depression screening) by clicking either of the Screen Now options. The fall-risk modal dialog was modified to support interventions to reduce fall-related injury. All four of these modal dialogs were modified to include the current date by default.
Adding “Intelligence” to drive the workflows:

Source: University of Missouri Health Care
How the proposed design works:
Source: University of Missouri Health Care
Proposed design:
Source: University of Missouri Health Care
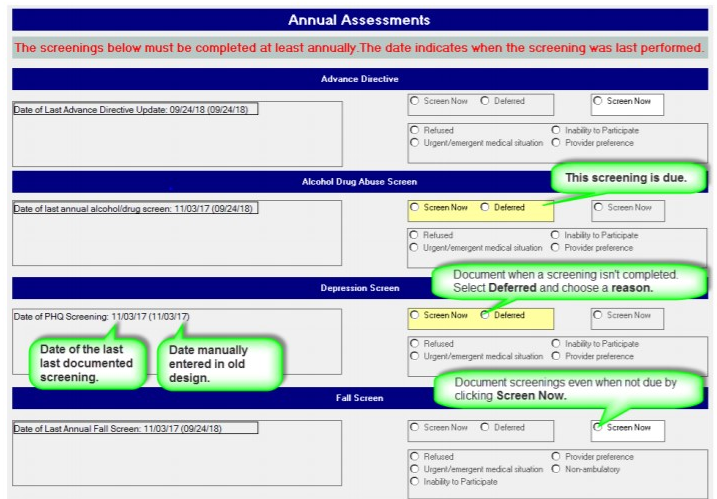
Team goals included the following UX principles:
- Simplicity
- Naturalness
- Consistency
- Minimizing cognitive load
- Efficient interactions
- Forgiveness and feedback
- Effective use of language
- Effective information presentation
- Preservation of context
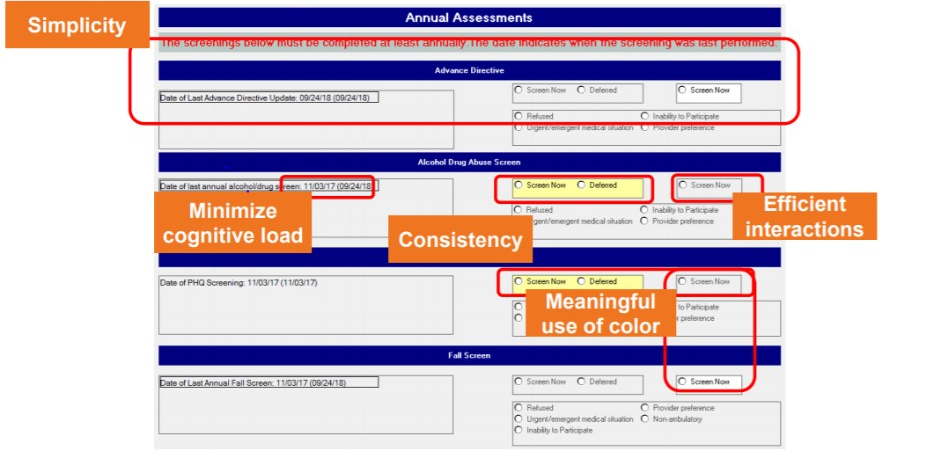
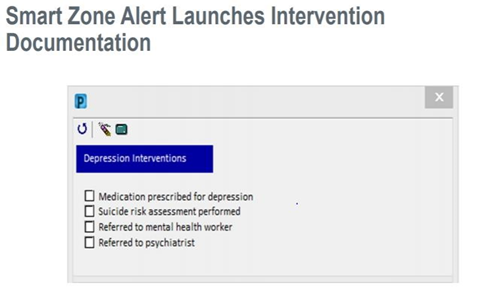
In phase two of the project, SmartZone™ CDS alerts were created for providers to notify them when either the screening is overdue or when a screening has been completed and is positive.
Overdue Screening Alert (introduced in April 2020):
The Depression Screening Due, Fall Risk Screening Due, Alcohol/Drug Screening Due, and Advance Directive Screening Due alerts display for patients who are overdue. Providers can also launch interventions documentation directly from the alert and the screening results will display within the form for the provider’s reference.
Source: University of Missouri Health Care
Source: University of Missouri Health Care
Improving Adherence to the Standard of Care
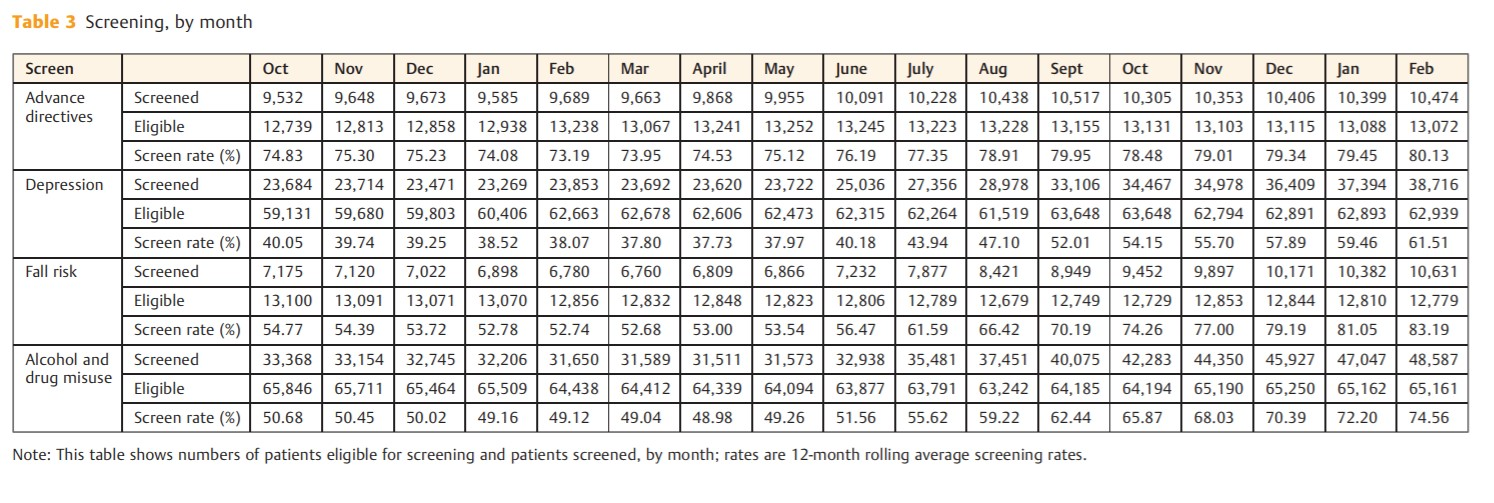
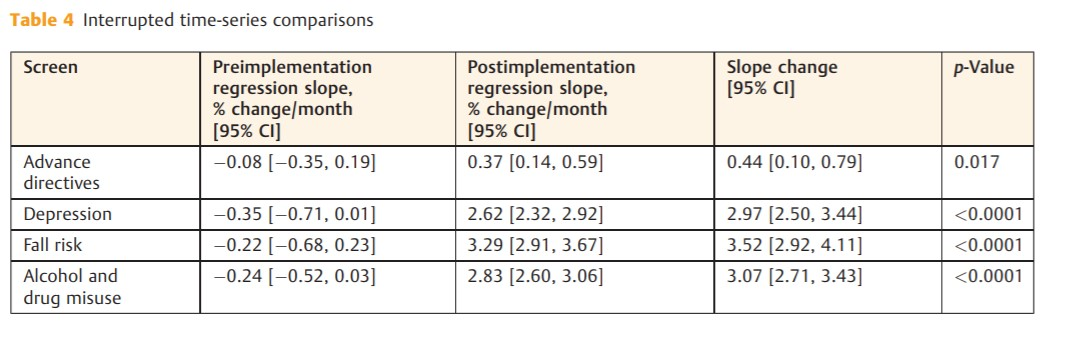
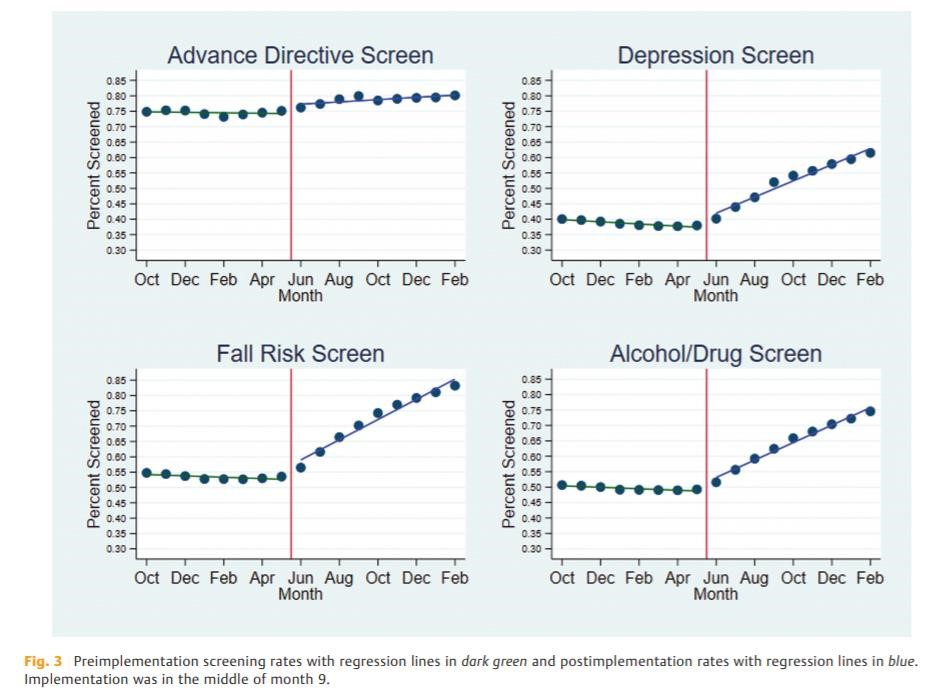
Following implementation of phase one, rates of annual screens for alcohol and drug misuse, falls risk, depression, and the provision of advance directives immediately improved. Interrupted time series analysis showed that the phase one UI redesign resulted in significant improvements in the rates of screening in all four annual screening domains. In the original work, the baseline screening rate for the provision of advance directive information was highest of the four metrics at 74.53% and was stable over the pre-implementation phase (0.08% [95% CI: 0.35, 0.19] per month). By the fifth month after implementation of the redesigned UI, the screening rate had increased to 80.13% and was increasing an average of 0.44% [95% CI: 0.10, 0.79] per month, p = 0.017. Depression screening was stable at 38.64% and did not increase prior to implementation, but post-implementation it was increasing by 2.97% [95% CI: 2.50, 3.44] per month, p < 0.0001. Screening for risk of fall improved the most of the four screening metrics, improving by 3.52% [95% CI: 2.92, 4.11] per month, post-implementation; p < 0.0001. While we believe some irregularities in the screening occurred and persisted due to COVID-19, eighteen months post-implementation, these improvements are sustained without any additional changes or educational efforts. Summative usability testing demonstrated improvements in task time, error rates and System Usability Scale scores. Interrupted time series analysis demonstrated significant improvements in all screening rates after implementation of the redesigned UI compared with the original implementation. Data for the study was obtained from the EHR’s core platform. See Table 1 for measure and measure steward.
Self-reported demographics were available for 10 of the 12 participants. They reported a median age range of 40 of 49 and an average of 7.7 years (range: 1–18) of experience with the EHR application. Participants using the redesigned UI had a reduced task time (6.0 vs. 8.3 s; difference in means: 2.3 s; 95% CI [0.9, 3.6]; p = 0.001; ►Table 2), while making fewer errors (0.10 vs. 0.83 errors/task; difference in means: 0.73 errors; 95% CI [0.50, 0.96]; p < 0.0001). Post implementation interviews with staff revealed that in some cases, nursing and medical assistant staff had been completing extra and unnecessary screenings simply because of the uncertainty as to which screens were due. SUS scores were higher for the redesigned UI (96.9 vs. 80.8; difference in means: 16.0; 95% CI [3.0, 29.1]; p = 0.021). The redesigned UI had a higher mean number of clicks (1.2 vs. 0.10; difference in means: 1.1; 95% CI [0.3, 1.8]; p = 0.007). Because the additional deferral fields made the redesigned UI larger, one click on the scroll bar was needed for most users to see the bottom of the redesigned UI, but users did not mention this during testing. We anticipated that from the original UI users might search out the information needed for a screening decision, but they did not. A decision to screen was based almost entirely on the information provided in the UI, for most with no additional clicks at all. There were no significant differences in cursor movement or SEQ scores for tasks requiring identification of overdue screens. The method the nursing and medical assistant staff documented deferral of screening in the existing system was inconsistent across the four screening domains. It required a complex workflow, navigating to other areas of the EHR.
Participants favored the redesigned UI for deferral tasks, with a higher SEQ score (4.91 vs. 3.81; difference in means: 1.01; 95% CI [0.03, 2.15]; p = 0.045) and a reduced task time (12.9 vs. 32.8 s; difference in means: 19.9 s; 95% CI [1.7, 38.1]; p = 0.035; ►Table 2). This implementation did include changes in modal dialog for fall-risk screening which was launched from the redesigned UI and the mean task time for completion of fall-risk screening was lower when the screening was performed from the redesigned UI (9.6 vs. 15.6 s; difference in means: 6.0 s; 95% CI [2.3, 9.7]; p = 0.005). The modal dialogs for depression and alcohol and drug misuse screening did not change, yet the mean task time for completion of these screens was reduced when launched from the redesigned UI (►Figure 8). Total errors were reduced for depression screening with the redesigned UI, but otherwise clicks, cursor movement, error rates, and task-level satisfaction as measured by the SEQ were not significantly different. Comments elicited through a concurrent “think aloud” protocol and retrospective probing aligned with the quantitative findings and did not reveal any additional usability problems with the redesigned prototype UI. No further changes were made prior to implementation.
Summative usability testing demonstrated improvements in task time, error rates and System Usability Scale scores. Interrupted time series analysis demonstrated significant improvements in all screening rates after implementation of the redesigned UI compared with the original implementation.
Source: University of Missouri Health Care
Numerators and denominators remained generally constant across the project period, and the number of screened patients increased significantly after implementation of the redesigned UI (►Figure 9).
Source: University of Missouri Health Care
The improvements in the UI led to increased utilization and decreased errors in the documentation of the annual assessment screens. An overall observed improvement in the adherence to documentation requirements was achieved.
Improving Patient Outcomes
In the original work, the usability improvements resulted in significant improvements in the rates of screening in all four annual screening domains. The baseline screening rate for the provision of advance directive information was highest of the four metrics at 74.53% (►Figure 10) and was stable over the pre-implementation phase (0.08% [95% CI: 0.35, 0.19] per month; ►Figure 11). By the fifth month after implementation of the redesigned UI, the screening rate had increased to 80.13% and was increasing an average of 0.44% [95% CI: 0.10, 0.79] per month, p = 0.017. Depression screening was stable at 38.64% and not increasing prior to implementation, but post-implementation it was increasing by 2.97% [95% CI: 2.50, 3.44] per month, p < 0.0001. Screening for risk of fall improved the most of the four screening metrics, improving by 3.52% [95% CI: 2.92, 4.11] per month, postimplementation; p < 0.0001 (Fig. 2).
Source: University of Missouri Health Care
Source: University of Missouri Health Care
Sustainment of the improved screening rates has been positive and covers the required 18-month period for submission.
Source: University of Missouri Health Care
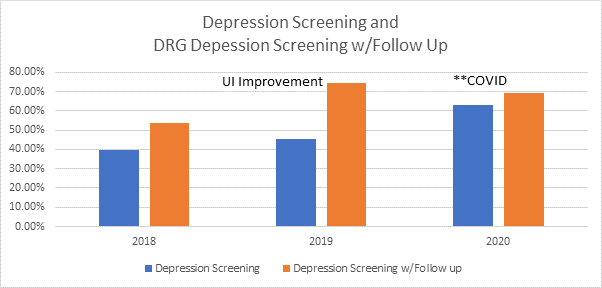
The measure stewards for the annual screenings targeted in the original work all support a preventable negative impact or improved clinical/economical impact when screenings are completed. The screens allow staff and providers to identify at-risk persons and to target evidence-based interventions.1-3 Additional data also supports an improvement in documented depression follow-up plans in conjunction with the improved annual depression screening new UI rollout. The denominator is all Medicare beneficiaries. The numerator is those that were screened and scored negative for depression and those that were screened and scored positive for depression and had follow up if positive.

Source: University of Missouri Health Care
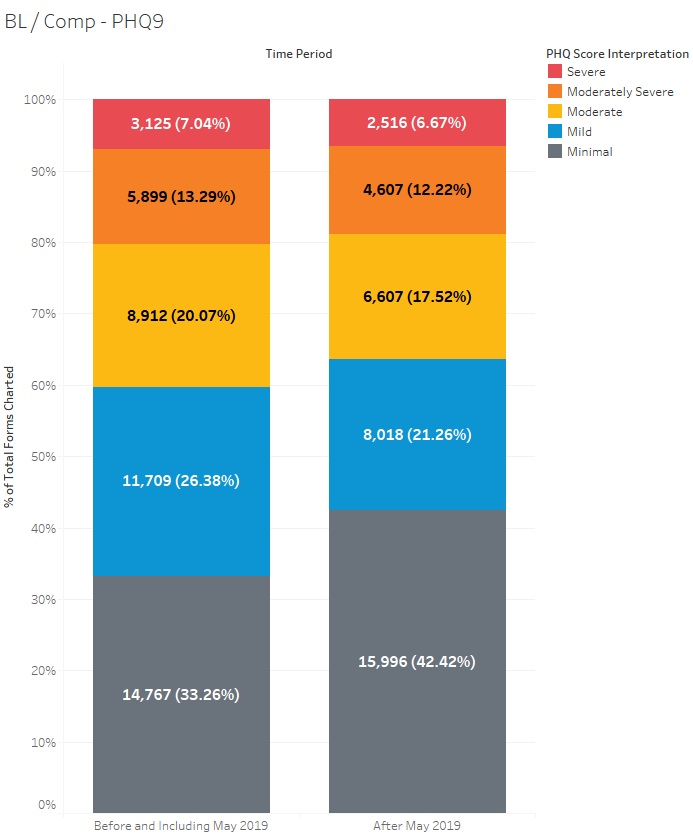
Data also indicate there has been an increase in Depression Screening, an increase in Depression Screening with Follow-up (DRG data), and an overall decrease in PHQ9 scores. The # of scores in the “Minimal Depressed” interpretation range have increased over time and the # of “Moderate to Severe” interpretation range have decreased over time.
Source: University of Missouri Health Care
Approach & Definitions
- Data extracted from University of Missouri Health P810 Cerner domain
- Checked for activity of the ‘Patient Health Questionnaire 9 Score’ event set
- Interpretations of PHQ scores (minimal, mild, moderate, moderately severe, and severe) are based on Table 4
- Time ranges used
- “Before and including May 2019”: 1/1/2017 through 5/31/2019
The percentage of patients with a PHQ score interpretation of ‘minimal’ (score <5) is 9.16% higher since May of 2019. Mild and moderate scores have seen moderate decreases (~5% and ~2.5%, respectively). Moderately severe and severe have seen smaller decreases (~1% and ~0.4%, respectively).
Source: University of Missouri Health Care
The percentage of patients with a ‘Minimal’ score in 2020 was at least 6.9% higher than any prior year included in the analysis.

Source: University of Missouri Health Care
The average score has dropped by 0.9 points (8.5 7.6) in the comparison period.

Source: University of Missouri Health Care
Accountability and Driving Resilient Care Redesign
Our findings demonstrate the need for continued attention to improvement of EHR usability for nurses and ancillary staff. Staff members are often responsible for initial screening for depression, alcohol and drug misuse, and fall risk. Nurses share the same usability concerns as physicians. Poor usability of the EHR has been linked to psychological distress and negative work environment among nurses.6,7 In an international survey, nearly one-third of respondents noted problems with system usability.8 In the present study, addressing the usability problems and reducing the associated cognitive load not only reduced task time but also subjectively increased certainty regarding which screens were needed at each encounter. Engaged nurses are an important part of team-based care, and improving EHR effectiveness, efficiency, and satisfaction among nursing staff can be expected to result in improvements in health outcomes for patients. The highly configurable nature of many EHRs allows for significant differences in usability and user experience between sites, even between sites using the same vendor. The American Medical Informatics Association, in their 2013 recommendations for improving usability, advised clinicians to “take ownership” for leading the configuration of the system and adopting best practices based upon the evidence, but stopped short of recommending site-specific usability testing or UCD processes in system configurations. 9 This project also highlights the need for a shared, multi-stakeholder approach to usability at the time of EHR development. Our redesigned interface is built on a vendor-specific platform which, even when optimized, constrains the configurability and usability of the feature. If not required to meet certification criteria, platforms such as the one used in this project may not be subject to usability testing as part of federal certification programs. Health care organizations and providers must work with vendors to continue to enhance such platforms and improve feature functionality that might otherwise constrain site-specific configurations.
The Clinical Informatics Council (CIC) led the education, rollout, and follow-up to ensure proper documentation was completed per policy.
- Data examples for measurement have been provided throughout the submission.
- The information shared in this submission is based on the article – “The Effect of Electronic Health Record Usability Redesign on Annual Screening Rates in an Ambulatory Setting” in Applied Clinical Informatics, authored by a multidisciplinary team at the University of Missouri Health Care.
References
- O’Connor EA, Perdue LA, Senger CA, et al. . Screening and behavioral counseling interventions to reduce unhealthy alcohol use in adolescents and adults: updated evidence report and systematic review for the US Preventive Services Task Force. JAMA 2018;320(18):1910–1928
- Grossman DC, Curry SJ, Owens DK, et al; US Preventive Services Task Force. Interventions to prevent falls in community-dwelling older adults: US Preventive Services Task Force recommendation statement. JAMA 2018;319(16):1696–1704
- Weathers E, O’Caoimh R, Cornally N, et al. . Advance care planning: a systematic review of randomized controlled trials conducted with older adults. Maturitas 2016;91:101–109
- Formative vs. summative resear Quick and dirty versus slow and… | by Nick Dauchot | UX Collective (uxdesign.cc)
- Siu AL, Bibbins-Domingo K, Grossman DC, et al; US Preventive Services Task Force (USPSTF). Screening for depression in adults: US Preventive Services Task Force recommendation statement. JAMA 2016;315(04):380–387
- Vehko T, Hyppönen H, Puttonen S, et al. . Experienced time pressure and stress: electronic health records usability and information technology competence play a role. BMC Med Inform Decis Mak 2019;19(01):160
- Kutney-Lee A, Sloane DM, Bowles KH, Burns LR, Aiken LH. Electronic health record adoption and nurse reports of usability and quality of care: the role of work environment. Appl Clin Inform 2019;10(01):129–139
- Topaz M, Ronquillo C, Peltonen LM, et al. . Nurse informaticians report low satisfaction and multi-level concerns with electronic health records: results from an international survey. AMIA Annu Symp Proc 2017;2016:2016–2025
- Middleton B, Bloomrosen M, Dente MA, et al; American Medical Informatics Association. Enhancing patient safety and quality of care by improving the usability of electronic health record systems: recommendations from AMIA. J Am Med Inform Assoc 2013;20(e1):e2–e8
The views and opinions expressed in this content or by commenters are those of the author and do not necessarily reflect the official policy or position of HIMSS or its affiliates.
HIMSS Davies Awards
The HIMSS Davies Award showcases the thoughtful application of health information and technology to substantially improve clinical care delivery, patient outcomes and population health.
Related


Emerging Technologies
Articles

Davies Award of Excellence

Informatics
Case Studies